The Analytics feature in Discount Depot helps you measure the performance of your discount campaigns and understand their impact on sales and revenue.
Using the Analytics dashboard, you can:
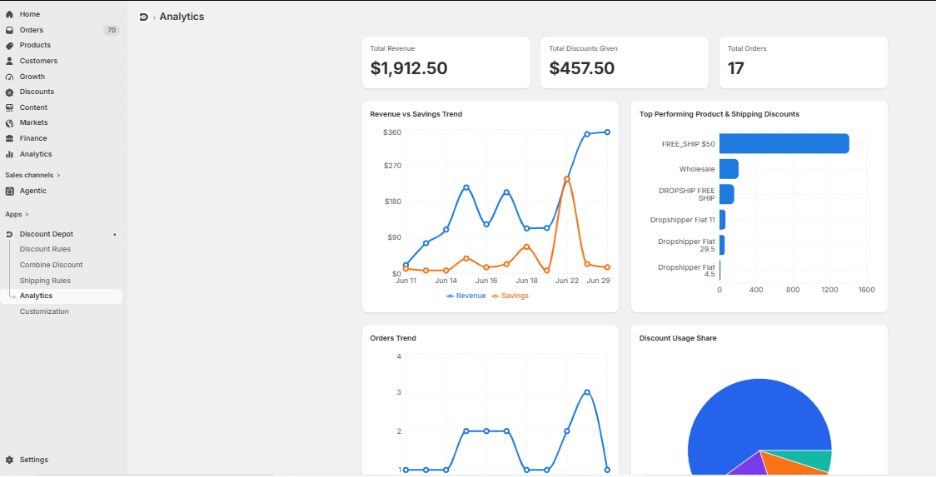
- View your total revenue generated through discounts.
- Track the total discount amount offered to customers.
- Monitor the number of orders influenced by your campaigns.
- Analyze revenue and savings trends over time.
- Identify your top-performing discounts and promotions.
- Review order trends and customer purchasing patterns.
- Understand the usage distribution of your discount campaigns.
- Filter analytics data using custom date ranges.
The Analytics dashboard provides valuable insights to help you optimize your discount strategies and improve store performance.
Note: Analytics data can be filtered by date range, allowing you to analyze campaign performance over specific periods.

Frequently Asked Questions
Can I filter analytics by date?
Yes. You can view analytics data for predefined or custom date ranges.
Can I see which discount performs best?
Yes. The Analytics dashboard displays your top-performing discount campaigns.
Does Analytics show revenue and savings data?
Yes. You can track both generated revenue and customer savings from your discount campaigns.